Dot - part of the command line toolbox
What is dot?
dot is a specification for describing graphs. You can see the formal grammar here. It’s part of the open source project Graphviz.
It’s easy to take Graphviz for granted, it’s been around forever (aka circa 1991). I didn’t even know that it came out of Bell Labs (you know, the place that friggen’ Unix came out of). But the project created a community and it’s still being updated today. Graphviz comprises a few different tools depending on what kind of network visualization you want. neato is for “spring model” layouts, twopi is for radial layouts, circo for circular layouts, and there are more. I’m going to focus on directed graphs, which uses dot.
That’s enough history, let’s see some graphs!
Heck yeah! Let’s make a simple graph. A is connected to B and B is connected to C.
// Define the graph
graph G {
  A -- B
  B -- C
  //Could also be written as: A -- B -- C
}
We can generate output using the dot command:
# Get the output using the dot command
$ dot -Tpng graph.dot > graph.png

# The -T flag determines type of output
$ dot -Tsvg graph.dot > graph.svg
$ dot -Tpdf graph.dot > graph.pdf
$ dot -Tjpg graph.dot > graph.jpg
# And many more options!
For the rest of these examples, I’ll be making directed graphs, which require a slightly different syntax.
// Define the graph
digraph G {
  A -> B -> C
}
Using the dot language, you define the graph, and Graphviz decides how to lay it out. This is great in most cases and exactly why I turn to dot. You give up control over how exactly the graph looks, but, hey, anything is better than drawing boxes on a PowerPoint slide.
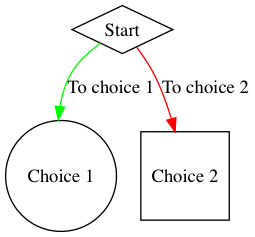
dot uses various attributes to customize graphs further.
digraph G {

  // A, B, C are nodes that can attributes
  A [label="Start",shape=diamond];
  B [label="Choice 1",shape=circle];
  C [label="Choice 2",shape=square];

  //Edges can have attributes too
  A -> B [color=green,label="To choice 1"];
  A -> C [color=red,label="To choice 2"];
}
Replicating a concrete example
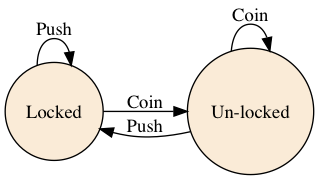
There is a good example of a finite state machine on Wikipedia:
It’s looks great! Let’s see how we can replicate that in dot.
digraph G {
  rankdir="LR"; // Set the layout to horizontal

  //Define the nodes
  L [label="Locked",shape=circle,style=filled,fillcolor=antiquewhite];
  UL [label="Un-locked",shape=circle,style=filled,fillcolor=antiquewhite];

  //Define the edges
  L -> UL [label="Coin"];
  UL -> L [label="Push"];
  UL -> UL [label="Coin"];
  L -> L [label="Push"];
}
It doesn’t look as great, but for the amount of work we put into, it gives a pretty good value.
Let’s break it down, why Graphviz is great
Handles all the layout for you
Drawing squares on a screen, connecting them, dragging them around is not my idea of a fun task. Humans are great at understanding visual representations of things, but I don’t want to spend a long time making them. Graphiz handles all of that for you. This becomes especially important when your graphs get bigger, when they have 10, 20, 1000 nodes in them. Representing it visually can help you understand it better, but trying to manually make that visualization will drive you crazy.
Formal text-based format is good for humans
On the creation side, a formal well-documented language makes it simple to create and edit graphs. If you use version control, it’s even very simple to see the changes to the graph over time. The textual representation of a very large graph takes up very little space on disk, as opposed to if you wanted to store a series of very large images.
Formal text-based format is good for machines
A formal well-documented language makes it simple for code to generate the dot representation as well! A recent example I know of is Terraform by Hashicorp. Terraform is a tool that automates creating infrastructure like servers, DNS records, load balancers, etc. To visually represent what Terraform creates, the authors implemented a command terraform graph that outputs to dot format. From the authors point of view, this is a huge win as they don’t have to re-implement all the network layout algorithms that Graphviz already handles.
